BI Dashboard Prototyping: Quickly create wireframes for business intelligence dashboards before building them in tools like Power BI or Tableau. This helps in visualizing the end product and making necessary adjustments early.
Client Presentations: Design dashboard wireframes to showcase potential analytics and insights to clients. This allows clients to see a visual representation of what their final dashboard will look like.
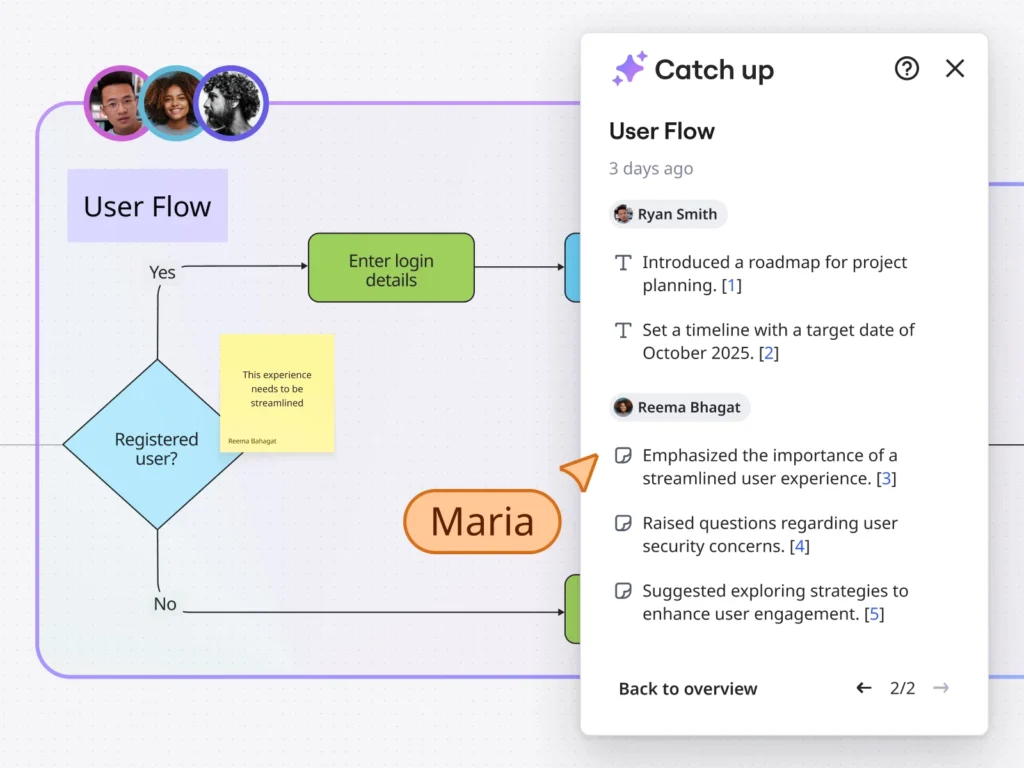
Team Collaboration: Use Mokkup.ai to create wireframes that multiple team members can review and comment on in real-time, making it easier to gather feedback and iterate on designs.
Product Management: Product managers can use Mokkup.ai to prototype dashboards that track key metrics and KPIs, helping them plan and communicate their vision to stakeholders.
Internal Reporting: Business owners and professionals can design custom dashboard wireframes that align with their company’s branding and reporting needs, which can later be implemented in BI tools.
Education and Training: Educators and trainers can use Mokkup.ai to create dashboard templates and examples for teaching purposes, helping students learn about data visualization and dashboard design.
Marketing Campaign Tracking: Marketers can create wireframes for dashboards that track the performance of marketing campaigns, allowing them to visualize metrics like conversion rates, traffic sources, and ROI before the actual dashboard is built.
Accessibility for Non-Designers: Mokkup.ai is designed for professionals who may not have a background in design. Its ease of use makes it accessible to a wider audience, enabling them to create effective wireframes without needing advanced design skills.

